Category Archives: Engineering

My Journey to the Cryptomine – A Toastmaster Speech

Last August I gave a Toastmaster speech on bitcoin, which stood at ~$2,700/bitcoin. It went all the way to almost $20K but today is ~$11,000/bitcoin. With that kind of swing, there’s lots of money to be made or lost. There are many ways to profit OR sustain loss from cryptocurrencies. You can buy the bitcoins or other cryptocurrencies outright and cash out when it fetches a high price – buy low, sell high. But I never believe in the get-rich quick scheme, probably because of my past record of painful experiences.

One of the “sure” ways to make money from cryptocurrencies is to mine the coins. What does it mean to mine crypto currency? The mining process is a way to earn the coin without paying for it directly.

Before we go any further, let me back off a bit and give you a bitcoin primer. The methodology applies to other cryptocurrencies. All transactions are recorded in blocks. Each block is like a page of ledger books consists of ~2000 transactions. They are chained together like the binding of a ledger book, hence the name blockchain. This is so no one can insert a “fake” block/ledger page into the book to double-spend or spend more than they have. To promote decentralization, validation or clearance of a block is performed by miners as contests to win a pot of 12 ½ bitcoins plus fees. Bingo! When first one who create a 256-bit hash/checksum that meets a certain format, usually number of leading 0’s, wins the entire pot. Then on to the next block. The difficulty of the game readjust automatically so that each block takes about 10 minutes. The reward got halved every 4 years or so.

How do the miners earn the coin? By doing the hard work or making the computers doing the work of validating the ledgers of each block of transactions once every 10 mins for bitcoin or shorter time for the altcoins. The miners’ job is to bundle all transactions into a block or a page of ledger and perform the “Proof of Work” by trying and retrying to come up with a hash code that meet a certain format: at least some number of leading zeros. In return, the first person or team/pool who comes up with the correct format shout “Bingo” or some other words get 12.5 bitcoins today plus all the transaction fees within the block. The same process goes on every 10 minutes 24×7 nonstop. This is a case for bitcoin. The other coins usually have a similar process.

I decided to try mining over the Christmas holidays because I was bored. But first, I need to decide which crypto coin I want to mine. I looked around and tried to determine which coin provides the highest return with minimal investment. Bitcoin was out of question because in order to be profitable, the equipment must be able to “hash” at TH/s or billions of hashes within a second or you may be paying more in electricity to PG&E than the reward you’re getting. The special equipment costs around $6K, too much upfront cost for my taste.

I finally decided on mining Ethereum, which would require buying a graphic card or GPU, which cost ~$400 for a popular AMD model. They were very difficult to find online or retail shops. Half of the aisle of the GPU cards were empty as of last weekend I checked. Then I bought some special extension cable to bring the GPU card outside of my home PC to supply separate power (another $50). Next, I decided on which pool to join. For Ethereum, the choice was easy. I picked the biggest. The pool aggregates all the miners’ results and winnings and share the profit the entire pool earns. If you go solo, you may be mining for years before getting the pot of money for the black statistically. I followed the directions and downloaded the software the pool requires and ran it. Tried running another recommended software still got the same bad result until I heard on the net about a firmware tweak on the GPU. Flashing the firmware could potentially risk bricking the GPU card. I hesitated and decided to take the bite. I scouted the internet for tips of what memory and CPU timing to tweak to maximize the “hash” rate. Evidently, someone has tried and probably bricked a few GPUs along the way. I tried it and got lucky; I boosted the GPU performance by 25%. Now I was ready for prime time. Let’s get the dough rolling.

For several days, I watched and observed the payout slowly creeping up. After 4 days, I was earning about $13, then the crypto market had a correction and dropped the earning down to $10 or roughly $2.50/day. Taking the electricity cost into account, I was earning roughly $1.50/day. It would take me 300 days to earn back my gear. I could scale up to more GPUs, right? I couldn’t find the same GPU for $400 anymore. It’s now $520 on eBay if I could find it.

I have tried mining one other altcoin, the payout was even worse. Like the gold rush, the winning party may end up being the one providing the shovel: GPU vendors and ASIC chip vendors.

The good news is that I can now sell the GPU on eBay and even make $100 back. But more importantly, I no longer have to hear the loud fan noise in my den. Ah! A peace of mind of no mine!

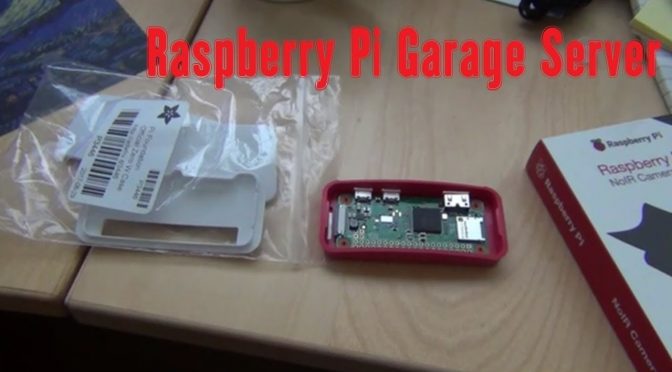
Raspberry Pi Garage Server – an IoT Project


This is my newfound interest – IoT or Internet of Things. I have been taking in all the Maker movements and decided to do something about it. This particular project Raspberry Pi Zero W was the first of the many IoT projects I plan to do and bring you along in my journey. Raspberry Pi Zero W is one of my favorite controller because it’s compact, inexpensive ($10) and with built-in Wifi and well supported by the Raspberry Pi community.

I wouldn’t say this was challenging to me as I have done more difficult and complex hardware design in my career as a hardware development engineer, designing the big-iron mainframe computer and multi-CPU servers. But this was probably more fun as I got to sense and control the real-life environment and it’s relative inexpensive to do.

I look forward to sharing more of this type of projects with you, in addition to all the “boring” book reviews, according to my daughter, I will continue to make.

Book Review: “Think Bayes” by Allen Downey

I vaguely remember ever learned about Bayes’ Theorem in college. Until I read this book I never thought there are so many applications of Bayes’ Theorem in our daily life. The drug companies uses it to get FDA approvals on drugs. The food companies applies the theorem to “prove” certain foods are good for us. In a way, the theorem allows us to change our perception of certain events’ probability of occurring. I can imagine more applications than the ones he outlines in the book. By the way, the pdf format of this book can be freely downloaded here, thanks to the author’s generosity.

Because of this book and his Youtube videos, I got interested in re-learning Python as a practical/useful programming language. It opened my eyes to the wonderful world of Python and its ecosystem.

The book gets pretty technical fast after the first chapter which piqued my interest with his Cookie, M&M, and Monte Hall problems. At the end I don’t know if it’s really necessary to know all the various applications in prediction and simulation, but it could come in handy for people who work in the statistical field.

The key thing to remember is that Bayes Theorem gives a way to update or arrive at the posterior probability of a prior/known hypothesis, H, after learning some new piece of data. The equation is simple: P(H|D)=P(H)*P(D|H)/P(D)
As it turn out, the most difficult part is P(D) or the normalizing factor, which is the probability of seeing the data under any hypotheses at all.

Overall, all the concepts presented by the author make sense to me. I’m not sure I can actually implement and devise the models when the actual problem arrives. But at least I can recognize the Bayesian problem when I see one and know where to find help.

Chapter Summary:
1. Bayes’s Theorem was derived easily and discussed. He introduced the probability calculator of getting a heart attack.

2. Computational Statistics: The author provides a set of Python codes/tools to calculate the result quickly. I had to re-take a Python refresher course before getting any further. But the tools are powerful and help me understand the subject better. All the codes and downloadable from thinkbayes.com website. It took me a while to figure out Monte Hall’s problem – one of those paradox that’s hard to sink in.

3. Estimation: This chapter estimates the posterior probability upon rolling of a multi-face die (4-/6-/8-/12-/20-sides die) and successive rolling of dice (more data points changes the probability distribution), and probability of the number of locomotive given the observation of one locomotive number. This is when you really need to have the computer do the work for you. The intuitive part is that the more information you have, the better your estimation is going to be, as some data points would be ruled out. For example, finding 6 eliminates the 4-sided die.

4. More Estimation: In this chapter, the author covers the “biased” Euro coin problem. The interesting phenomenon is that the prior hypothesis makes little difference (provided you don’t rule things out with 0 probability), the posterior distribution will likely converge with more data points.

5. Odds and Addends: The author covers the “odds” form of the Bayesian Theorem, o(A|D)=o(A)*P(D/A)/P(D|B), which is probably easier to understand for most people. The Addends part of the chapter goes into getting the density and distribution functions.

6. Decision Analysis: Given a prior distribution function, what’s the best decision to make given some data. The author presented a Price Is Right scenario and solve the best price to bid for a show case showdown based the past data and best guess to adjust the bid. The PDF, Probability Density Function, is introduced here. Also the use of KDE (Kernel Density Estimation) is used to smooth PDF that fits the data. This is an interesting application of Bayes Theorem. The math is complicated and couldn’t be done without a computer. I guess it would be good to bring your computer to the Price Is Right game.

7. Prediction: Here the author presented a better way to predict the outcome of a playoff game score based on past data between two teams (Boston Bruin vs. Vancouver Canucks.) This should be no difference from how the gambling industry computes the odds before a big game. Just imagine all the gambling earning you could’ve made by mastering this chapter! I’m sure someone has applied the same idea/theory to the financial market like stocks, bonds and futures.

8. Observer Bias: This is another angle of predicting the outcome (like the wait time for the next train at a given time) taking into account of the observer bias.

9. Two Dimensions: Using the paintball example, the author applies the Bayesian framework to the two-dimensional problem. In addition, the joint distribution , marginal distribution, and conditional distribution. And you don’t think one dimensional Bayesian framework is confusing enough…

10. Approximate Bayesian Computation (ABC): When the likelihood of any particular dataset is 1) very small, 2) expensive to compute, 3) not really what we want. We don’t care of about the likelihood of seeing the exact dataset we saw but any dataset like that.

11. Hypothesis Testing: The Bayes Factor, the ratio of likelihood of a new scenario to that of the baseline, can be used to test the likelihood of a particular hypothesis, e.g. fairness/cheat of an Euro coin. Bayes factor of 1~3 is barely worth mentioning, 3~10 is substantial, 10~30 strong, 30~100 very strong, >100 decisive.

12. Evidence: Test for the strength of evidence. “How strong is the evidence that Alice is better than Bob, given their SAT score?”

13. Simulation: Simulate the tumor growth rate based on prior growth rate and the data points of current tumor size, age and etc.

14. A Hierarchical Model: reflects the structure of the system, with causes at the top and effects at the bottom. Instead of solving the “forward” problem, we can reverse engineer the distribution of the parameters given the data. The Gaiger counter problem demonstrates the connection between causation and hierarchical modeling.

15. Dealing with Dimensions: This last chapter combines all of the lessons so far and applies to the “Belly Button Bacteria” prediction and simulation. This is a very difficult chapter to understand and probably requires the full understanding of the previous lessons.


Book Review: “What is a p-value anyway? 34 Stories to Help You Actually Understand Statistics” by Andrew J. Vickers

Review on Video:

When I was studying engineering, Statistics was not a required subject. It wasn’t until I started working that I appreciated the power of statistics. In this imprecise world, many things can be explained only in statistic terms like confidence level, insufficient sample size and etc. I got a full lesson of statistics as part of the my MBA degree curriculum. Ever after taking many more statistics-related class and going through a full Six Sigma Green Belt training, there are a few things about statistics that are still hard to grasp. It’s not just p-value that confused people, there are simply too many pitfalls when novices or even experts apply statistics to real life problems.

The author organizes 34 stories across 34 chapters. Since the author works in the medical field, he mentioned quite a few tidbits about how drugs were clinical tried. It’s a good book for beginners as well as people who used statistics regularly to watch out for its pitfalls. You might get a different perspective about statistics. I did.

My key takeaways – some refresher and something new:
1. Many things in life doesn’t follow normal distribution, especially the ones involve physical ability (pregnancy duration, body BMI). Sometimes log scale fits better.
2. Two sorts of variation: observable natural variations (reproducibility), variation of study results (repeatibility).
3. Statistical ties, e.g. in election poll, means that the confidence interval includes/overlaps with no difference.(Chap. 12)
4. P-values test hypotheses. (Chap. 13)
5. Statistics are mainly used for inference (test hypotheses) or prediction (extrapolation, interpolation).
6. Null hypotheses is a statement suggesting that nothing interesting is going on (status quo) that there is no difference between that observed data and what was expected or no difference between two groups. The P-value is the probability that the data would be at least was extreme as those observed if the null hypotheses were true.
6. T-test vs. Wilcoxon test (new to me). If the data is very skewed, use Wilcoxon test whose data must be converted to ranks first. (Chap. 16)
7. Precision (width of confidence interval) = variation/ sqrt(sample size). To reduce the confidence interval (enhance precision) by half, you’d need 4 times of the sample size – very expensive. To get the sample size for a specific test = (noise or variation / signal or confidence interval )^2.
8. “Adjust the results” can be applied to multi-variable regression to help with confounding (confusing). (Chap. 19).
9. Sensitivity is the probability of a positive diagnostic test given that you have the disease (true positive). Specificity is the probability that a negative diagnostic test given that you don’t have the disease (true negative). The most worrisome situations are when the test comes back positive if they indeed have the disease (positive predictive value) or when the test comes back negative and the patient is truly free of disease is the negative predictive value. (Chap. 20)
10. Don’t accept the null hypothesis. Instead say “we could not show a difference.” Don’t use a p-value of 0, say “P < 0.001" instead. 11. Some test methods, e.g. chi-squired and ANOVA, only provides P-value - no estimates. Correlation provides estimates but no inferences. 12. One common error is to calculate the probability of something that has already happened. Then come into conclusions about what caused it based on whether that probability is how or low. E.g. calculation of the odd OJ killed his wife. Instead, the question to ask is "if a woman has been murdered and has been previous beaten by her husband, what is the chance of he was the murderer." 13. Conditional probability depends on both the probability before the information was obtained (prior probability of a heart disease) and the value of he information (such the accuracy of the heart test). 14. The more statistical tests you conduct, the greater the chance that one will come up statistically significant, even if the null hypothesis is true. 15. A smaller study has a good chance of failing to reject the null hypothesis, even if it's false. Subgroup analysis increases both the rise of falsely rejecting the null hypothesis when it's true and falsely failing to reject the null hypothesis when it's false. 16. P-values measure strength of evidence, not size of an effect.
17. Don’t compare p-values.
18. Many statistical errors occur because of starting the clock at the wrong time.
19. Lead time bias. If you find a way to find the problem earlier, then the time between the problem and the end result will be longer.
20. Statistics is used to help scientists analyze data, but is itself a science.
21. Statistics should be about linking math to science: a. think through the science and develop statistical hypotheses in the light of specific question. b. interpret the results of the analysis in terms of their implications for those questions.
22. Statistics is about people even if you can’t see the tears.

Simulink World Tour

Last week, I had an opportunity to participate in the Simulink World Tour, hosted by Mathworks. I was attracted by the agenda of showing all different applications of Simulink. Personally, I have been fascinated by the easy and intuitive way to build a system and solve for the solution. That’s the way mathematic should be – to help people visualize and construct the problem. The actual mechanics of solving for the mathematic solutions is less than interesting, at least for me.

In the morning session, they showed off a bunch of stateflow, design verifiers modules, VHDL code generation, which are good for logic verification. They also added PolySpace to check for code correctness.

What stood out for me are the embedded Matlab C code, which are great to speed up execution speed once it’s compiled. The image processing demo in the video surveillance application was quite interesting. I didn’t know the execution speed could be fast enough to do that. They also showed a hybrid car’s electro-mechanical system built with simulink and how the gas mileage fluctuated when the gas peddle is floored. This demonstrated how the system modules can be built and simulated when the interface behavior are properly modeled.

During the buffet lunch, I observed that most of the participants came from the defense industry. They probably deal with system simulations a lot due to the analog/RF nature and the interactions between electrical and mechanical systems. I can see how powerful simulink can be if put to good use. I would like to play with simulink but haven’t seen a good fit for my line of work, where things tend to be mostly digital. The analog-digital interface has been largely shielded by the chipsets. I’m still looking…